- View more resources from this publisher
 Core Maths
Tooltip
These resources have been reviewed and selected by STEM Learning’s team of education specialists for factual accuracy and relevance to teaching STEM subjects in UK schools.
Patriotic Design
In this activity students explore the idea of correlation. The resource contains an overview, teacher guidance, data sheet and handouts. The activity provides an introduction to correlation, showing the basis of Spearman’s Rank Correlation Coefficient, but also indicating there are other methods of trying to measure the correlation between two sets of data.
Patriotic Design Overview gives a brief outline of the statistical ideas behind this resource. It suggests an initial discussion about choices of things your students would include in the list of icons before making comparisons. It suggests alternative data e.g. top twenty songs which could be used in similar comparisons of rank order.
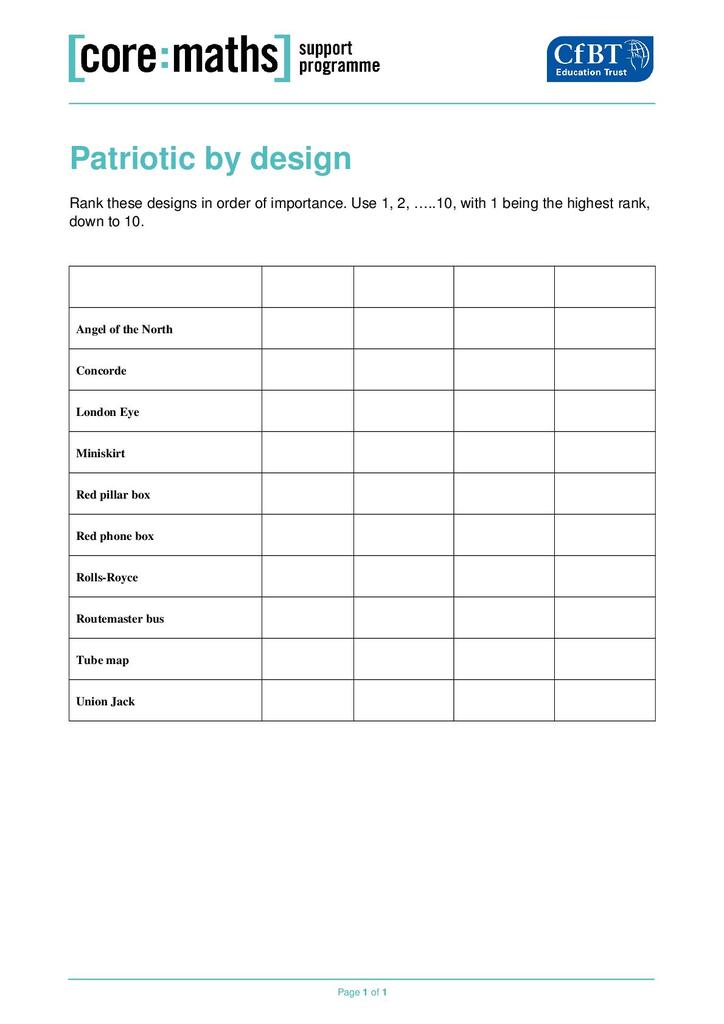
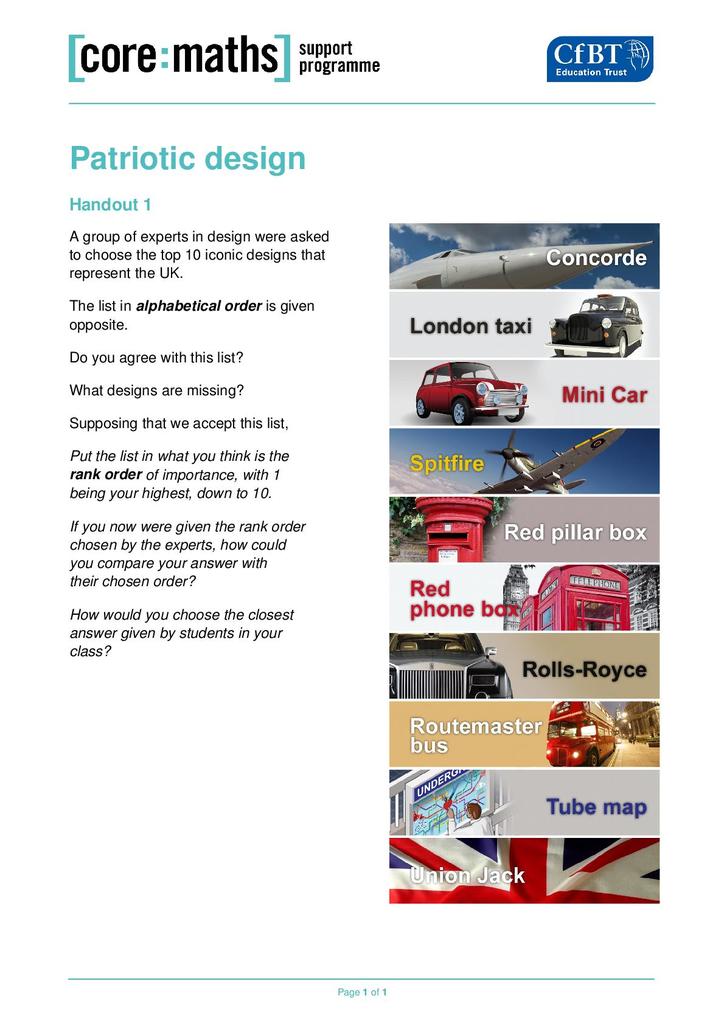
Patriotic Design Handout One: Here students make their own ranking of the ten top icons of the UK so that their ranking can be compared with the survey results. The problem is to see which student has the ranking which is closest to the ranking in the survey results. This raises the need for some statistical process to help the decision making.
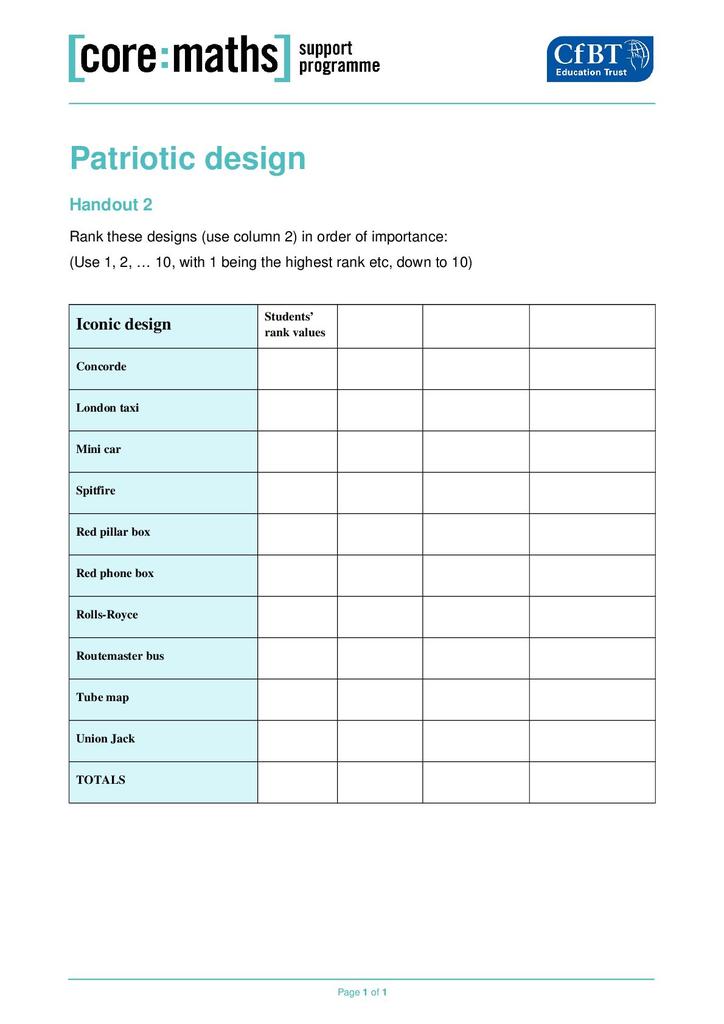
Patriotic Design Handout Two: Here the student's ranking is compared with the survey result (Statistics Rank Order). In order to make progress the column headings would need to be supplied (see the guidance document) or be identified through group discussion. A spreadsheet could be used at this stage.
Teacher Guidance: This document provides guidance for teachers. It explains that the activity is based upon the results of a survey of opinion regarding the most iconic designs of the UK. It also explains how the two handouts are to be used, especially the second one as some of the column headings are not shown. If this resource is to be used as an introduction to Spearman's Rank Correlation Coefficient then a link is provided here. Some ideas for extension activities are given.
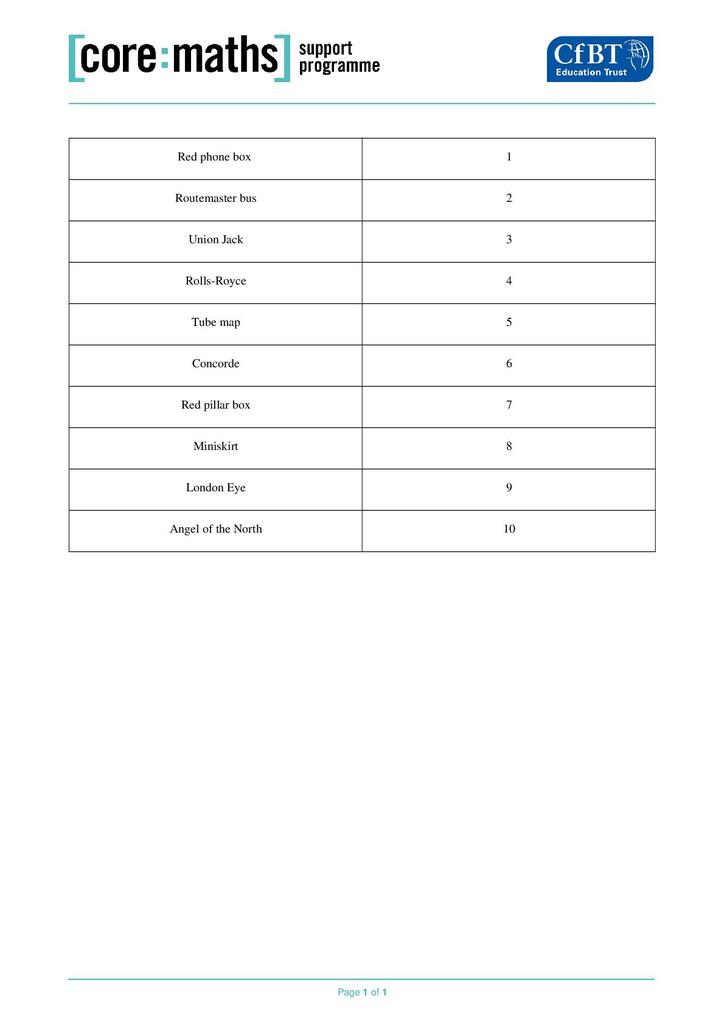
Patriotic Design Data Sheet One is a data sheet showing the top twenty items in a poll of 2,000 adults. The student activity using the handouts only uses the first ten of these.
Rank Order shows the rank order of the top ten items in the poll of the 2,000 adults. This ranking is the first half of data sheet one
Show health and safety information
Please be aware that resources have been published on the website in the form that they were originally supplied. This means that procedures reflect general practice and standards applicable at the time resources were produced and cannot be assumed to be acceptable today. Website users are fully responsible for ensuring that any activity, including practical work, which they carry out is in accordance with current regulations related to health and safety and that an appropriate risk assessment has been carried out.
Downloads
-
Patriotic Design (teacher guidance) 210.52 KB
-
Patriotic Design (overview) 210.37 KB
-
Patriotic Design (activity sheet) 208.54 KB
Show downloads
-
 Patriotic Design (teacher guidance) 210.52 KB
 -
Patriotic Design (overview) 210.37 KB
-
-
Patriotic Design (activity sheet) 208.54 KB
-
-
-
-
Download all files as a .zip2.77 MB
Information on the permitted use of this resource is covered by the Category Three Content section in STEM Learning’s Terms and conditions.


